Value stream mapping
Value stream mapping
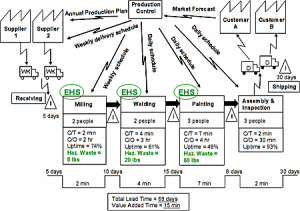
What is « Value stream mapping » ?
• Not Just Agile tool
• Lean manufacturing technique
• Illustrates flow, queues
• Used to determine waste to be removed
• Focus on value adding
Value stream mapping
Value Stream Mapping Steps :
1. Identify product / service to improve
2. Create as-is value stream map
3. Identify delays, waste, and constraints
4. Create to-be value stream map
5. Develop roadmap to optimized state
6. Revisit the process in the future
Value Stream Mapping Example :
Create a Value Stream Map for buying a cake to eat with your friend to celebrate passing the ACP exam.
Step 1 – identify starting point of the process (who initiates it) and the end point (who gets the end result)
You ……………………………………………………………………………………………………You & Friend eat cake
Step 2 – Identify the high level steps, inventories, and queues through the process
You…Cake Selection…..Bakery counter….Payment….Unpack & slice…You & Friend eat cake
Step 3 – Identify any supporting groups and alternative flows
You…Cake Selection…..Bakery counter….Payment….Unpack & slice…You & Friend eat cake
…………………………………….Bakers Sales
Step 4 – Measure the value-adding and non-value-adding activities; calculate efficiencies; and identify waste, bottlenecks, and improvement actions
You…Cake Selection…..Bakery counter….Payment….Unpack & slice…You & Friend eat cake
……………………………………Bakers Sales
Value add :
You…Cake Selection…..Bakery counter….Payment….Unpack & slice…You & Friend eat cake
……………1 mn 2 mn 2 mn 2 mn 10 mn
None Value Add (waiting) :
You…Cake Selection…..Bakery counter….Payment….Unpack & slice…You & Friend eat cake
……………………………..4 mn 6 mn 15 mn 5 mn
Total Cycle Time = Value Add Time + Non Value Add Time Total Cycle Time = 47 mn
Process Cycle efficiency = Total Value Add Time / Total Cycle Time
Process Cycle Efficiency = 17 mn / 47 mn = 36%
Value stream mapping process steps :
1. Identify product / service to improve
2. Create as-is value stream map
3. Identify delays, waste, and constraints.
4. Create to-be value stream map
5. Develop roadmap to optimized state
6. Revisit the process in the future
Waste :
See also Agile, Lean and waste
7 Forms of Waste
Waste 1 : Partially done work
Description : Work started, but not complete; partially can entropy
Example : Work waiting for QA, Requirements waiting for development
Waste 2 : Extra processes
Description : Extra work that does not add value
Example : Unused documentation, Unnecessary approvals,
Waste 3 : Extra features
Description : Features that are not required, or are thought of as nice to haves
Example : Gold plating, Technology features
Waste 4 : Task switching
Description : Multi-tasking between several different projects that have context-switching penalties
Example :People on multiple projects
Waste 5 : Waiting
Description : Delays waiting for reviews and approvals
Example : Waiting for prototype reviews, Waiting for document approvals
Waste 6 : Motion
Description : The effort required to communicate or move
information or deliverables from one group to another; if teams are not co-located, this effort may need to be greater
Example : Distributed teams, Handoffs
Waste 7 : Defects
Description : Defective documents or work products that needs correction
Example : Requirement defects, Impractical processes
Value stream mapping example
Identify the wastes.
You……..Cake Selection…………..Bakery counter……………Payment…………..Unpack & slice………….You & Friend eat cake
Bakers Sales
Value add :
1 mn 2 mn 2 mn 2 mn 10 mn
None Value Add (waiting) :
4 mn 6 mn 15 mn 5 mn
Create To-Be Value Stream Map
– Without the waste
( Phone the “Cake Caterer” and place an order for delivery )
( Removes Waiting and Travel time wastes )
You…..Call…..Cake Caterer…..Order Cake……Provide Credit Card Details…..Unpack & slice……..You & Friend eat cake
Order Taker Order Taker
Value Add :
1 mn 2 mn 2 mn 2 mn 10 mn
None Value Add :
2 mn 1 mn 10 mn 5 mn
Total Cycle Time = Value Add + Non value Add time
Total Cycle Time = 35m
Process Cycle efficiency = Total Value Add Time / Total Cycle Time
Process Cycle Efficiency = 17m / 35 = 49%
Leave a Reply
You must be logged in to post a comment.